Lesson Data analysis

Fundamental analysis

Learn how to use research reports and market trends to help refine your strategy and inform your investment decisions.

man-researching-stock-fundamentals
In investing terms, “fundamental data” refers to all the collective information that can directly impact the performance of a security. Fundamental analysis is meant to give you a good idea of a potential investment’s inherent value–which can be very helpful when you’re building your portfolio.

The purpose of fundamental analysis is to determine the intrinsic (or “true”) value of a security, as free from personal or market bias as possible. This can have two outcomes: it can help an investor to get a sense of the long-term profitability of an investment, while also indicating if the current trading price of the security is a good deal relative to its true value.

While we will talk about fundamental analysis in the context of stocks in this article, some of the principles can also apply to other investment products such as ETFs, bonds, foreign exchange contracts, and more.

Fundamental analysis is often contrasted to its counterpart, technical analysis, which focuses on historical trends and market movements rather than the intrinsic value of the underlying company or security.

Quantitative and Qualitative fundamental data

A common misconception is that fundamental analysis is just about numbers. While a good deal of it does revolve around objective data such as earnings, revenue, and cash flow, fundamental analysis includes a lot of factors that are up for interpretation, such as brand strength, corporate leadership, and the level of competition within the marketplace. For this reason, many people separate quantitative data, which is hard numbers and indisputable facts, from qualitative data, which is data that’s up for interpretation.

Both data types have their benefits. Quantitative data is completely grounded in mathematical absolutes and is therefore, in its raw form, theoretically free from interpretation and personal bias. On the other hand, qualitative nuance is part of why well-informed investing can be as profitable as it is: if the stock market could be solved with one universal qualitative data set, then everyone would just use that “right answer”, and that lack of risk would likely mean the returns you see in the market would be considerably lower.

While some might have a preference towards either qualitative or quantitative data analysis, both can work together to offer a comprehensive picture of the security that you’re analyzing so you can make more informed investing decisions.

Micro-fundamentals vs macro-fundamentals

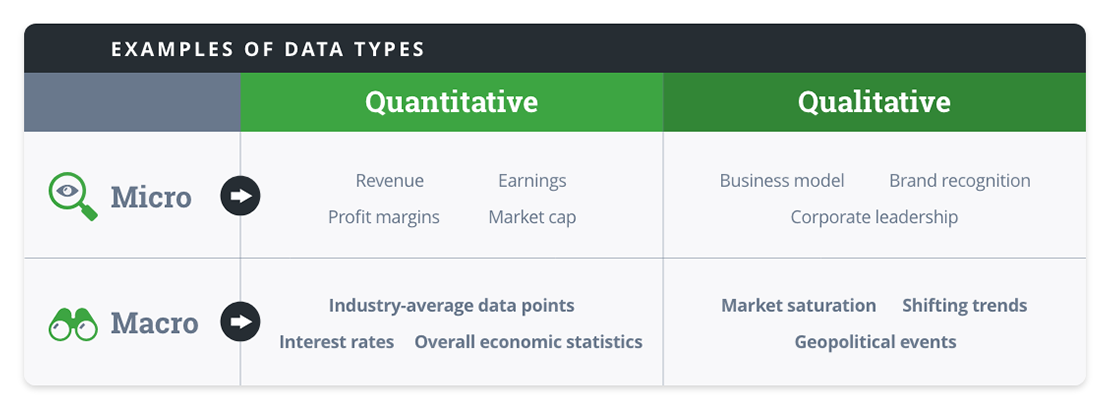
Fundamental data can also be categorized into macro or micro data, based on whether you’re looking at data that represents something within the company you’re looking at (micro-fundamentals), or if the data represents an outside force that can have an impact on the value of its shares (macro-fundamentals).

The distinction between micro and macro is different from quantitative and qualitative, and can be combined to neatly classify fundamental data points:
micro-macro-quantitative-qualitative-chart

Top-down vs bottom-up

While both macro- and micro-data are important, there is some debate within the world of economics whether it’s better to take a top-down or bottom-up approach when conducting fundamental analysis.

Bottom-up primarily uses micro-level data to determine the current and potential long-term performance of the individual corporation, with the main goal of discovering untapped value and gauging the long-term profitability of a company, and using macro-level data as supporting information to give additional context to your investment decision.
Top-down primarily uses macro-level data to determine the current and potential long-term performance of an industry, with the main goal of determining the overall value and gauging long-term profitability of the industry as a whole, and using micro-level data as supporting information to inform your final investment decision.
As with most debates in the field of economics, there’s no single correct answer. Both macro and micro level data can be important in their own way, and it’s up to your own judgment to determine which approach you think best suits your personal investing strategy.

Where to find fundamental data

Most micro-level data is publicly available and easily accessible. All Questrade platforms allow you to look at a position details screen that includes some basic data. Here you can find fundamentals such as EPS (Earnings Per Share), which is the net profit of a company divided by the number of shares that have been issued, the market cap, which is the total value of all issued shares, and the P/E (Price/Earnings) ratio, which measures the current stock price against the company’s total earnings. You can also look up corporate earnings and guidance reports through Questrade Edge Web or Desktop. 

You can learn more about in-platform data on our Basics of market data page.

While the position details screen provides some helpful information at a glance, corporate reports are a goldmine of fundamental data. Every listed company is required to report both quarterly and annual statements which are available through their corporate websites, usually through an investor relations page.

You can also use research tools to find both fundamental data and fundamental analysis: your newsfeed can help you to keep an eye on relevant macro-fundamental events, you can use watchlists to track the market prices of your high-valued stocks, and use TipRanks to take a look into the insights of professionals throughout the financial industry.

Value vs Quality in fundamental analysis

Fundamental data offers information on two similar metrics that represent two slightly different investment goals: value and quality.

Value investing means that you’re looking to find stocks that are currently undervalued by the market. Value investors tend to look more at indicators that determine the point at which the stock should be priced, and how it compares to the current market price. While the quality of a stock is still important, value investors tend to focus more on whether or not the investment is a good deal when they decide where to put their money.
Quality investing means that you’re more focused on the overall quality of the stock. While quality investors find it important to consider the value of a stock relative to its market price to make sure they’re not over-paying, quality investors tend to look more at indicators of performance and long-term growth potential, even if it’s not a bargain at the current market price.
Both quality and value are important considerations, and it’s entirely up to you and your own strategy as to which you place in higher regard.

Interpreting fundamental data

Interpretation is where you can very easily get lost in the weeds. There have been a great number of academic papers that have proposed different ways to interpret fundamentals towards various ends, and each theory has its proponents and detractors. Many of these assign a score based on whether or not a company meets certain requirements, such as the F-score and G-score which each have a different 9-parameter checklist, while others simply provide a formula, such as the PEG (Price/Earnings to Growth ratio) and the P/B (price-to-book) ratios which each of which combine several fundamental data points to give a numerical valuation.

These are just a handful of commonly used methods of interpreting fundamental data, and nobody can say with certainty whether one is objectively better than the others. If different methods of interpreting data interests you, there is a great deal of literature out there to show you new approaches to interpreting fundamental data. But ultimately, how you interpret the fundamental data that you collect is up to you.


Perhaps the most important take-away is this: fundamental data is not a guarantee of profitability, and there is constant debate over its best use. However, fundamental data can help to inform your investment decisions, giving you more tools to make even more informed investing decisions.

Note: The information in this blog is for educational purposes only and should not be used or construed as financial or investment advice by any individual. Information obtained from third parties is believed to be reliable, but no representations or warranty, expressed or implied, is made by Questrade, Inc., its affiliates or any other person to its accuracy.

Have more questions?

Tell us what you need help with, and we’ll get you in touch with the right specialist.