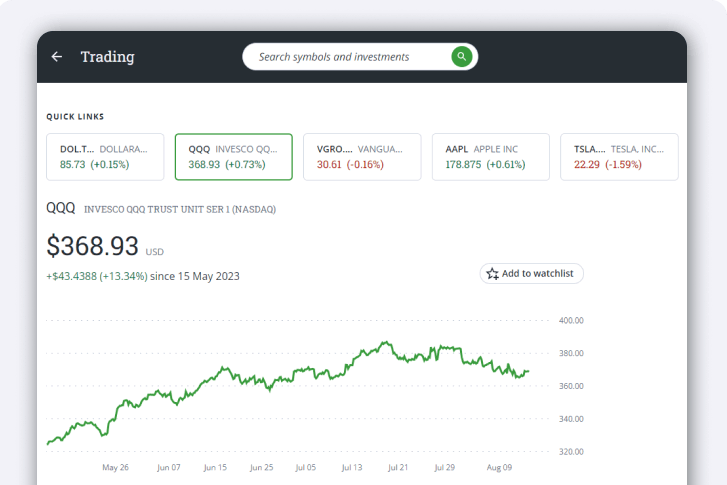
The quote page shows the essential information such as bid, ask, market cap and more (also known as Level 1 data).
Lesson Questrade Trading
Exploring Stock and ETFs Quotes
Learn how to find stocks and ETFs and understand the information in a quote.

Stock and ETF quote search
Easily find a quote by using the Symbol lookup bar at the top of your screen.
Alternatively, you can select any symbol in your quick links, watchlists, positions, or orders tabs below.

-
Select the Symbol lookup bar.
- Here, you will also see choice to view your Recent searches, which will show your recently searched stocks and ETFs.
- You will also see a list of top gainers, most active, best rated and most rated stocks that you can also choose from.
- To browse bonds and Guaranteed Investment Certificates (GICs) online, select GICs and Bonds.
-
Enter the ticker symbol, or search by the company or ETF name.
- After you’ve found the security you’re looking for, simply select it to open the quote page.
Stock and ETF Quotes
The quote page provides clear information on the security you're interested in.

Let's review the different parts of the quote page:
- At the top of the page, you’ll see Quick Links to your recently viewed investments.
- Tap the Snap Quote button to refresh the quotes on this page to the up-to-the-second price.

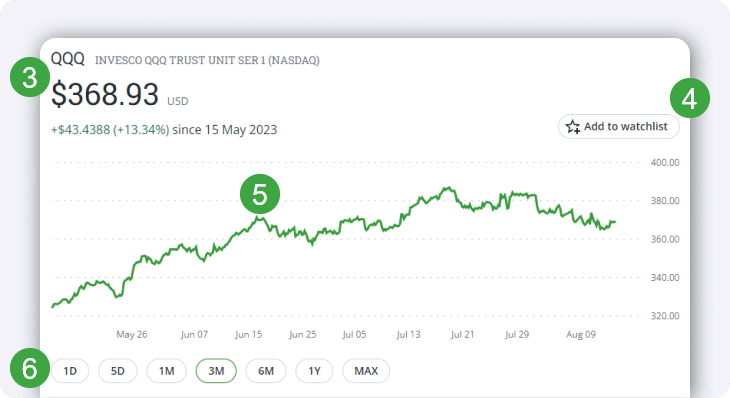
- The security’s ticker symbol and name will be visible, along with the last traded price, and P&L since market open.
- To add this security to your watchlist(s), tap the Add to watchlist option. Next, select the watchlist(s) that you would like to add this symbol to.
- You can scroll your mouse across the chart to view the price change over the selected time range.
- Change between viewing different time ranges from one day (1D) to this security’s Max time range (since the security first started trading).
To view the stock or ETF quote, choose your self-directed account and preferred order type from the widget located on the right side of the screen.
The Order Entry Window
The Order entry window has everything you need to easily make trades.

Starting at the top of the order entry screen, you’ll see the following:
- The order type you selected and the security’s Bid or Ask price.
- The Ask displays the lowest price sellers are currently willing to accept for the security.
- The Bid shows the highest price buyers are currently willing to offer for the security.
- To order by dollar value, enter the Total amount you want to spend. For market orders, this will automatically populate the Quantity field with an estimate of how many shares that amount will buy.
- To buy a specific number of shares, enter the Quantity of shares you want to buy. For market orders, this will automatically populate the Total amount field with an estimate of how much those shares will cost.
- This will display the account that you are using. You can change between self-directed accounts by clicking here and choosing an account from the drop-down.
- This will show you how much cash you have in your account. For margin accounts, it will show you how much buying power you have.
Key Statistics
Below the historical performance chart, you’ll find the Key statistics about the stock or ETF you have selected.
Here you’ll find detailed information to give you a statistical perspective of how the asset is currently trading in relation to its past performance, key ratios, upcoming important dates and more.

- Previous close shows the price at market close (4:00 pm ET) from the previous trading day.
- The Open represents the price at market open (9:30 am ET).
- The Low and High are the lowest and highest the stock or ETF has traded since the market open.
- Similarly, the 52 week low and 52 week high are the lowest and highest the stock or ETF has traded in the last 52 weeks.
- Dividends displays the dollar amount of the current dividend issued per share (if one is paid out).
- Ex-date is the deadline to buy a stock/ETF in order to receive the next dividend. To qualify for the dividend payment, you must own the shares at least 1 business day before the ex-date.
- In the example above, for an ex-date of June 16th, 2023 you would need to purchase the shares by June 15th, 2023 to qualify for the dividend.
- EPS represents the annual Earnings per share of this security, while P/E (price to earnings ratio) compares the share price against the EPS.
- Learn more about EPS and P/E in this article about Corporate earnings and guidance.
- Earnings date shows the anticipated earnings date for a company. This date may shift due to holidays and other factors, and the date shown in the platform is not finalized until a company confirms their earnings a few weeks before release.
- Market cap shows the “worth” of a company by multiplying the number of shares by the current share price.

- Bid sz represents the number of shares buyers are willing to purchase at a specified bid price. While Ask sz refers to the number of shares sellers are willing to sell at a specified ask price.
- Volume indicates how many shares of this security have traded hands since the market opened today.
- Avg volume indicates the average number of shares traded each day during regular hours.
- Shares shows how many shares of this security are currently available to be traded on the open market.
- Security type displays the category of the asset. For example, stocks, ETFs, bonds or cash.
- The Last trade field shows the time when the last trade has taken place for this security.
- Long and Short MR represents the Margin requirements for this security when buying (long) or shorting (short).
Stock/ETF Analysis

News

To access previous news articles, scroll down and select the title to expand the article.
Learn more about Key features and Research tools available in Questrade Trading.
Disclaimer: The content viewed on the TipRanks window is provided by a third party: TipRanks™. Questrade takes no responsibility for the accuracy or timeliness of the information displayed in the TipRanks window. Questrade does not accept liability in connection with the TipRanks window. The information displayed on the TipRanks window does not constitute advice or a recommendation by Questrade and does not represent the view and opinions of Questrade.
The content in the TipRanks window provides information about potential investments from a variety of sources including research analysts, online bloggers, trading reports and news sentiment. The third party research in these reports was not prepared in accordance with Canadian disclosure requirements. Bloggers publish their own personal opinions and may not have any formal education or qualifications. You should do your own research before investing and consider information from a wide variety of sources.
Note: Securities shown are for illustrative, educational, and visual purposes only, and should not be relied upon as financial advice. The information provided is not intended to be and should not be construed as a recommendation, offer, or solicitation to buy or sell.
Note: The information in this blog is for educational purposes only and should not be used or construed as financial or investment advice by any individual. Information obtained from third parties is believed to be reliable, but no representations or warranty, expressed or implied, is made by Questrade, Inc., its affiliates or any other person to its accuracy.
